Difference between revisions of "OpenNebula Administrative Functions"
| Line 15: | Line 15: | ||
You will then arrive on the Dashboard screen, from where you will then be able to access the various OpenNebula functions. | You will then arrive on the Dashboard screen, from where you will then be able to access the various OpenNebula functions. | ||
[[File:one_admin_log3.png|800px]] | [[File:one_admin_log3.png|border|800px]] | ||
| Line 22: | Line 22: | ||
To change your temporary password, click on your username at the top-right of the dashboard screen: | To change your temporary password, click on your username at the top-right of the dashboard screen: | ||
[[File:one_admin_pwch1.png|240px]] | [[File:one_admin_pwch1.png|border|240px]] | ||
And then click on “Settings”: | And then click on “Settings”: | ||
[[File:one_admin_pwch2.png|240px]] | [[File:one_admin_pwch2.png|border|240px]] | ||
The Configuration screen appears: | The Configuration screen appears: | ||
[[File:one_admin_pwch3.png|600px]] | [[File:one_admin_pwch3.png|border|600px]] | ||
Click on “Update password”: | Click on “Update password”: | ||
[[File:one_admin_pwch4.png|400px]] | [[File:one_admin_pwch4.png|border|400px]] | ||
The Update Password screen appears: | The Update Password screen appears: | ||
[[File:one_admin_pwch5.png|300px]] | [[File:one_admin_pwch5.png|border|300px]] | ||
| Line 53: | Line 53: | ||
To change to the “Cloud” view, start from the “Configuration” Screen (see [[#Password Change|Password Change]]) and click on “Conf”: | To change to the “Cloud” view, start from the “Configuration” Screen (see [[#Password Change|Password Change]]) and click on “Conf”: | ||
[[File:one_admin_viewch1.png|600px]] | [[File:one_admin_viewch1.png|border|600px]] | ||
Click on “Views:” and select the “cloud” view: | Click on “Views:” and select the “cloud” view: | ||
[[File:one_admin_viewch2.png|600px]] | [[File:one_admin_viewch2.png|border|600px]] | ||
And then click on “Update config”. You are now in the cloud view: | And then click on “Update config”. You are now in the cloud view: | ||
[[File:one_admin_viewch3.png|600px]] | [[File:one_admin_viewch3.png|border|600px]] | ||
To go back to the “User” view, click on your username at the top-right of the screen: | To go back to the “User” view, click on your username at the top-right of the screen: | ||
[[File:one_admin_viewch4.png|600px]] | [[File:one_admin_viewch4.png|border|600px]] | ||
Then click on “Change view”: | Then click on “Change view”: | ||
[[File:one_admin_viewch5.png|450px]] | [[File:one_admin_viewch5.png|border|450px]] | ||
| Line 83: | Line 83: | ||
You can see how much of your vDC is used either on the Dashboard under Quotas: | You can see how much of your vDC is used either on the Dashboard under Quotas: | ||
[[File:one_admin_vq1.png|630px]] | [[File:one_admin_vq1.png|border|630px]] | ||
Or in the Configuration screen by clicking on “Quotas” and then clicking on “Group Quotas”: | Or in the Configuration screen by clicking on “Quotas” and then clicking on “Group Quotas”: | ||
[[File:one_admin_vq2.png|600px]] | [[File:one_admin_vq2.png|border|600px]] | ||
| Line 95: | Line 95: | ||
You can see how many resources you have been using the “Accounting” function. You can access it either from the Dashboard (under the “Quotas” information) or in the Configuration screen by clicking on “Accounting”: | You can see how many resources you have been using the “Accounting” function. You can access it either from the Dashboard (under the “Quotas” information) or in the Configuration screen by clicking on “Accounting”: | ||
[[File:one_admin_acc1.png|600px]] | [[File:one_admin_acc1.png|border|600px]] | ||
Select a time period and click on “Get Accounting”. A similar screen appears with the corresponding information. | Select a time period and click on “Get Accounting”. A similar screen appears with the corresponding information. | ||
[[File:one_admin_acc2.png|800px]] | [[File:one_admin_acc2.png|border|800px]] | ||
By clicking on “Accounting Tables”, you can see your data in tabular form. | By clicking on “Accounting Tables”, you can see your data in tabular form. | ||
Revision as of 17:51, 14 September 2016
Log into OpenNebula
As a CipherSpace vDC customer, you have received a website address as well as your username and temporary password.
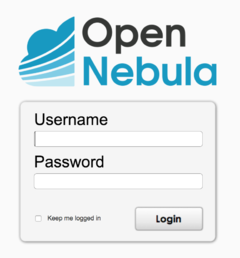
Type in your browser the website address. You should see the following screen:
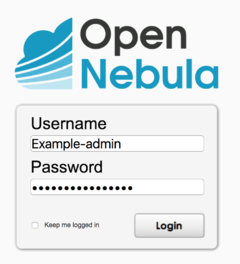
Type in your username and password and click on “Login”:
You will then arrive on the Dashboard screen, from where you will then be able to access the various OpenNebula functions.
Password Change
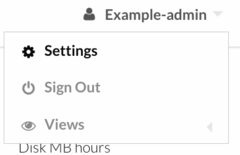
To change your temporary password, click on your username at the top-right of the dashboard screen:
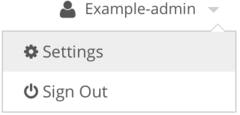
And then click on “Settings”:
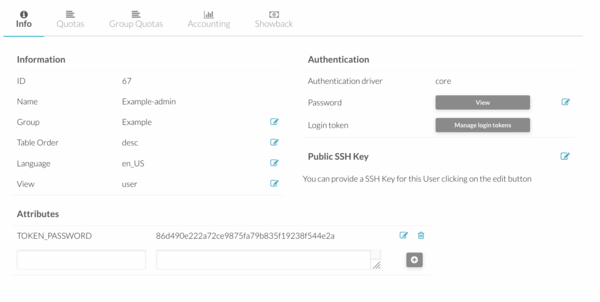
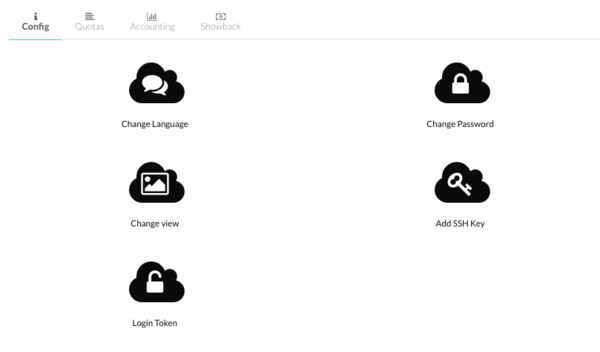
The Configuration screen appears:
Click on “Update password”:
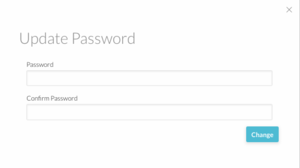
The Update Password screen appears:
Type and confirm your new password and click on “Change”. You can now log in using your new password.
View Change
A vDC user has access to two different user interfaces: the “User” view and the “Cloud” view. The “User” view allows the user to access the more advanced functionalities of OpenNebula. The “Cloud” view is a simplified user interface, which allows a user to deploy virtual machines (VMs) and to monitor and manage the running VMs as well as other limited functionalities.
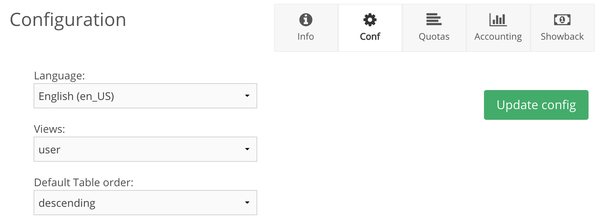
To change to the “Cloud” view, start from the “Configuration” Screen (see Password Change) and click on “Conf”:
Click on “Views:” and select the “cloud” view:
And then click on “Update config”. You are now in the cloud view:
To go back to the “User” view, click on your username at the top-right of the screen:
Then click on “Change view”:
Click on “cloud”, then select “user” and finish by clicking on “Update view”. You are now back to the “User” view.
View Quotas
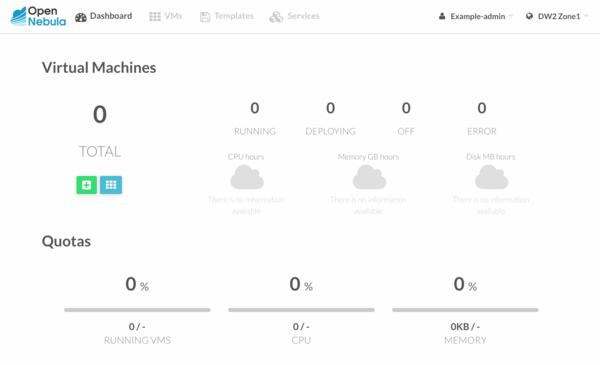
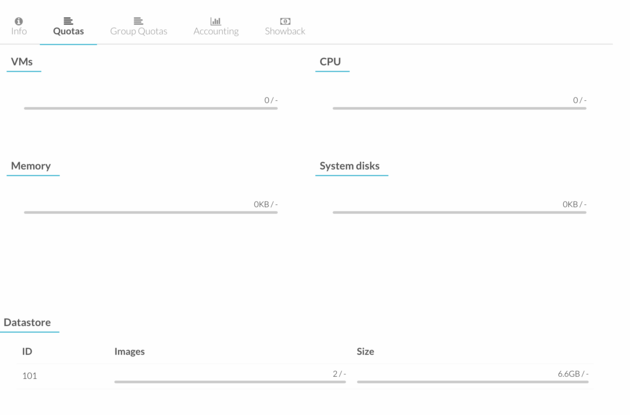
You can see how much of your vDC is used either on the Dashboard under Quotas:
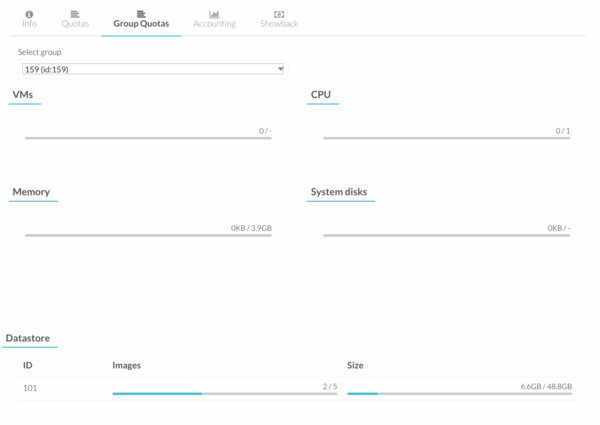
Or in the Configuration screen by clicking on “Quotas” and then clicking on “Group Quotas”:
Accounting
You can see how many resources you have been using the “Accounting” function. You can access it either from the Dashboard (under the “Quotas” information) or in the Configuration screen by clicking on “Accounting”:
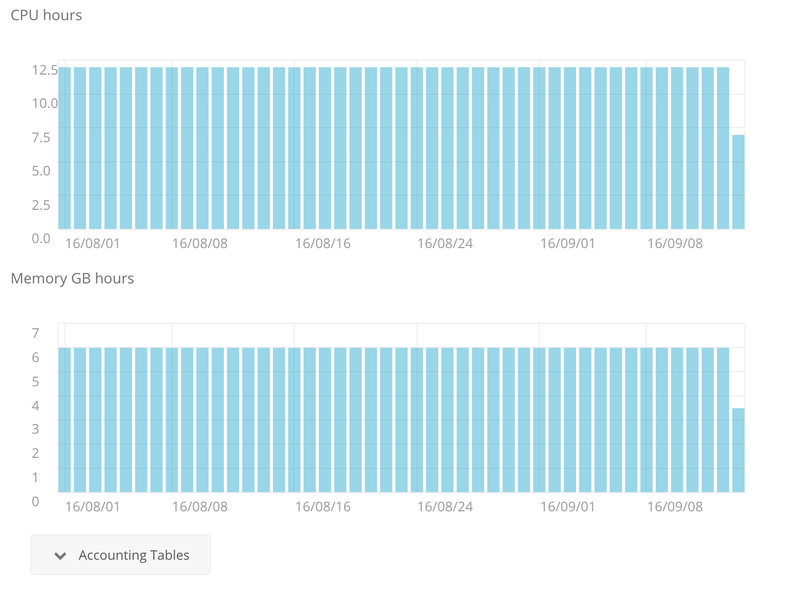
Select a time period and click on “Get Accounting”. A similar screen appears with the corresponding information.
By clicking on “Accounting Tables”, you can see your data in tabular form.
